
PAG stands for Pathway, Annotated-list and Gene-signature. A PAG geneset represents a set of genes that share a common feature, whether they belong within the same pathway, share common biological processes, are co-differentially expressed under a particular condition of an experiment or clinical sample, or share a common downstream target or function.
Pathway and Annotated-list Gene-signature Electronic Repository (PAGER) is an online systems biology tool for constructing and visualizing gene and PAG networks from multiple PAG genesets.
PAGER was implemented by using PHP language version 5 and Codeigniter version 2.1.3. PAGER data was stored in Oracle 12g database maintained by Indiana University and was connected to PHP server by Oracle Instant Client software. P-value for each edge in PAGs' networks was computed on the fly by using hypergeometric function provided by PDL. For gene and PAGs' networks visualization in PAGER, cytoscape.js, a JavaScript graph library for network visualization.
PAGER currently contains a total of 113,830 PAGs from 37 data sources, and is being updated weekly. We welcome you to add your PAGs to PAGER ( link ).
For full breakdown on PAG sources, refer to the table below:
| Version | Type | Source | Count | |
|---|---|---|---|---|
| v.1 updates | P | Reactome | 528 | 33412 |
| MSigDB-c2(CP) | 1320 | |||
| KEGG | 199 | |||
| Spike | 28 | |||
| PharmGKB | 102 | |||
| WikiPathway | 144 | |||
| NCI-Nature Curated | 132 | |||
| BioCarta | 252 | |||
| Protein Lounge | 388 | |||
| A | MSigDB-c2(CGP),c3 | 6199 | ||
| G | GeneSigDB | 2942 | ||
| MSigDB-c4 | 858 | |||
| GAD | 1671 | GWAS Catalog | 1230 | |
| NGS Catalog | 56 | |||
| N | Genome Data | 17363 | ||
| v.2 updates | A | GOA | 21894 | 56140 |
| GTEx | 92 | |||
| Pfam | 1161 | |||
| G | DSigDB | 22455 | ||
| MSigDB-c7 | 4852 | |||
| mirTARbase | 2603 | |||
| PheWAS | 1358 | |||
| Microcosm Targets | 851 | |||
| TargetScan | 390 | |||
| Isozyme | 484 | |||
| v.3 updates | P | GeoMx Cancer Transcriptome Atlas | 110 | 24278 |
| A | Cell | 22 | ||
| G | I2D | 15874 | ||
| HPA-PathologyAtlas | 20 | |||
| HPA-TCGA | 7932 | |||
| HPA-normProtein | 105 | |||
| HPA-FANTOM5 | 45 | |||
| HPA-normRNA | 43 | |||
| HPA-RNAcon | 62 | |||
| HPA-CellAtlas | 31 | |||
| HPA-GTEx | 34 | |||
| Total | 113830 | |||
PAGER has several unique features available:
- PAGER not only allows users to construct two types of PAG networks, PAGER enables users to construct gene interaction or gene regulation networks within a PAG.
- PAGER allows users to construct three types of expanded PAG networks including upstream, downstream, and co-membership PAGs. Constructing expanded PAGs networks enables users to find key genesets related to their study.
- Because PAGER offers gene networks, users can also construct expanded gene networks from a gene including networks of upstream, downstream, and sibling genes.
- PAGER provides an interactive visualization tool for users to study gene and PAGs' networks and offers spaces, Gene Box and PAG Box, for users to store their genes and PAGs.
For examples of how to use PAGER, please see Use Cases.
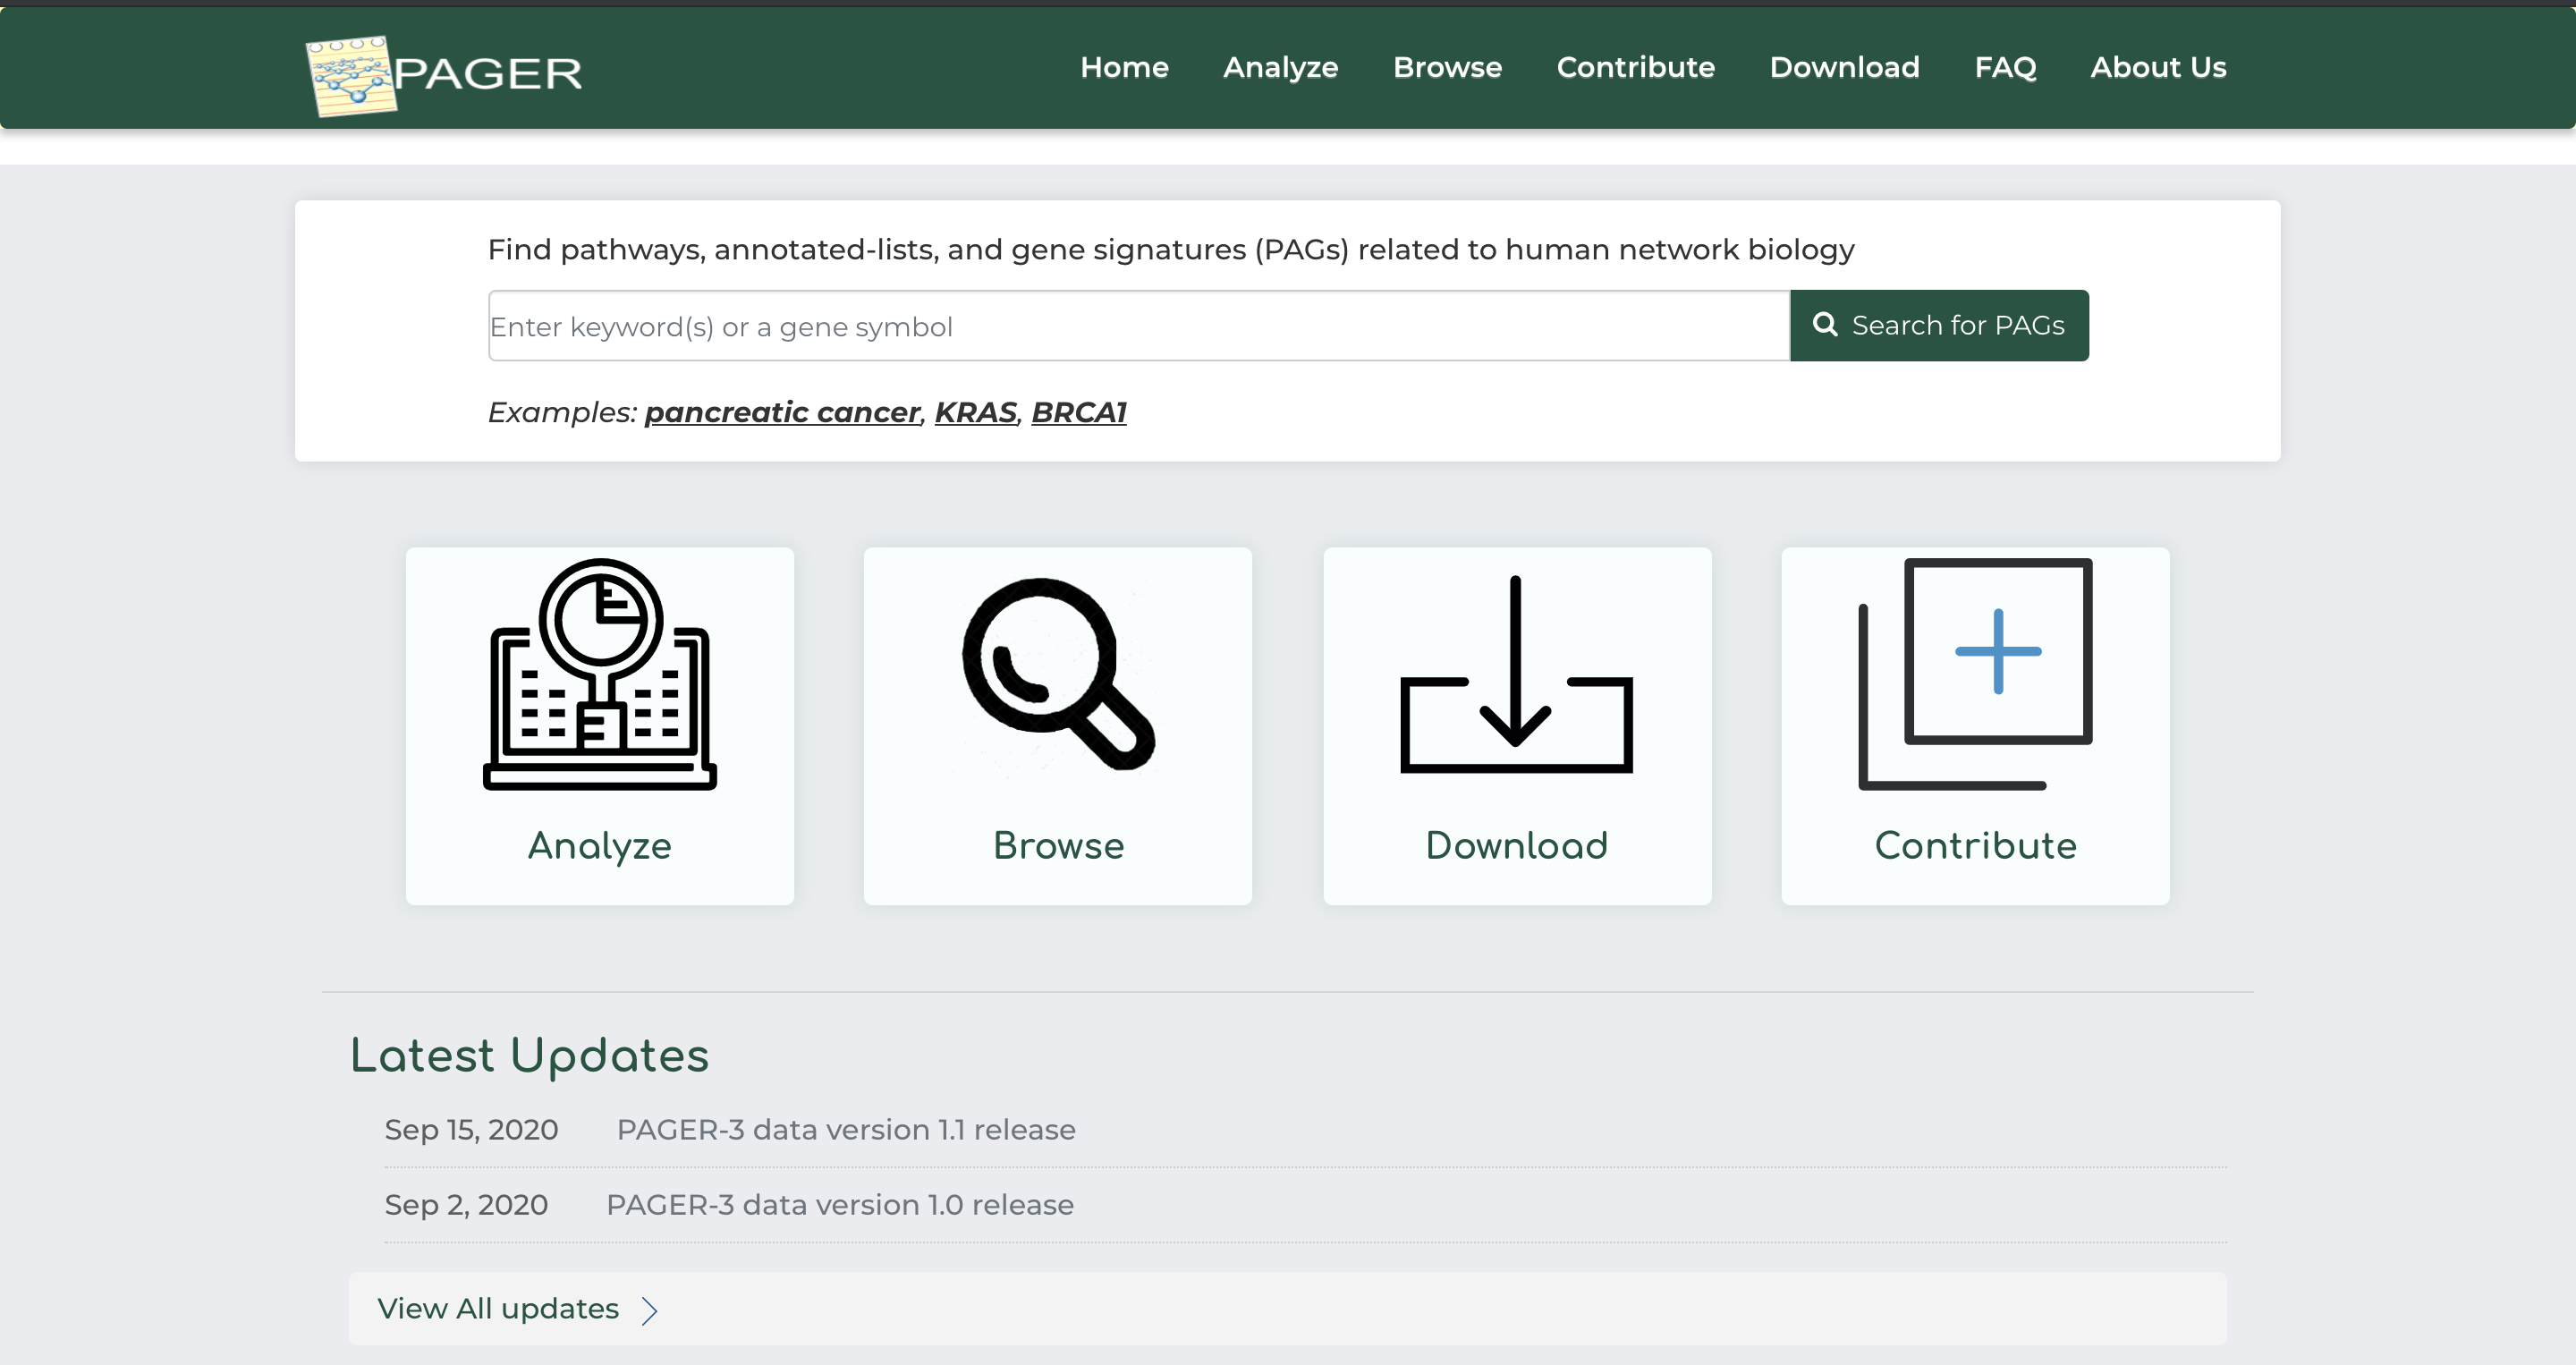
Users can perform a basic search query for PAGs in PAGER by entering a keyword or gene symbol into the search bar on the home page:
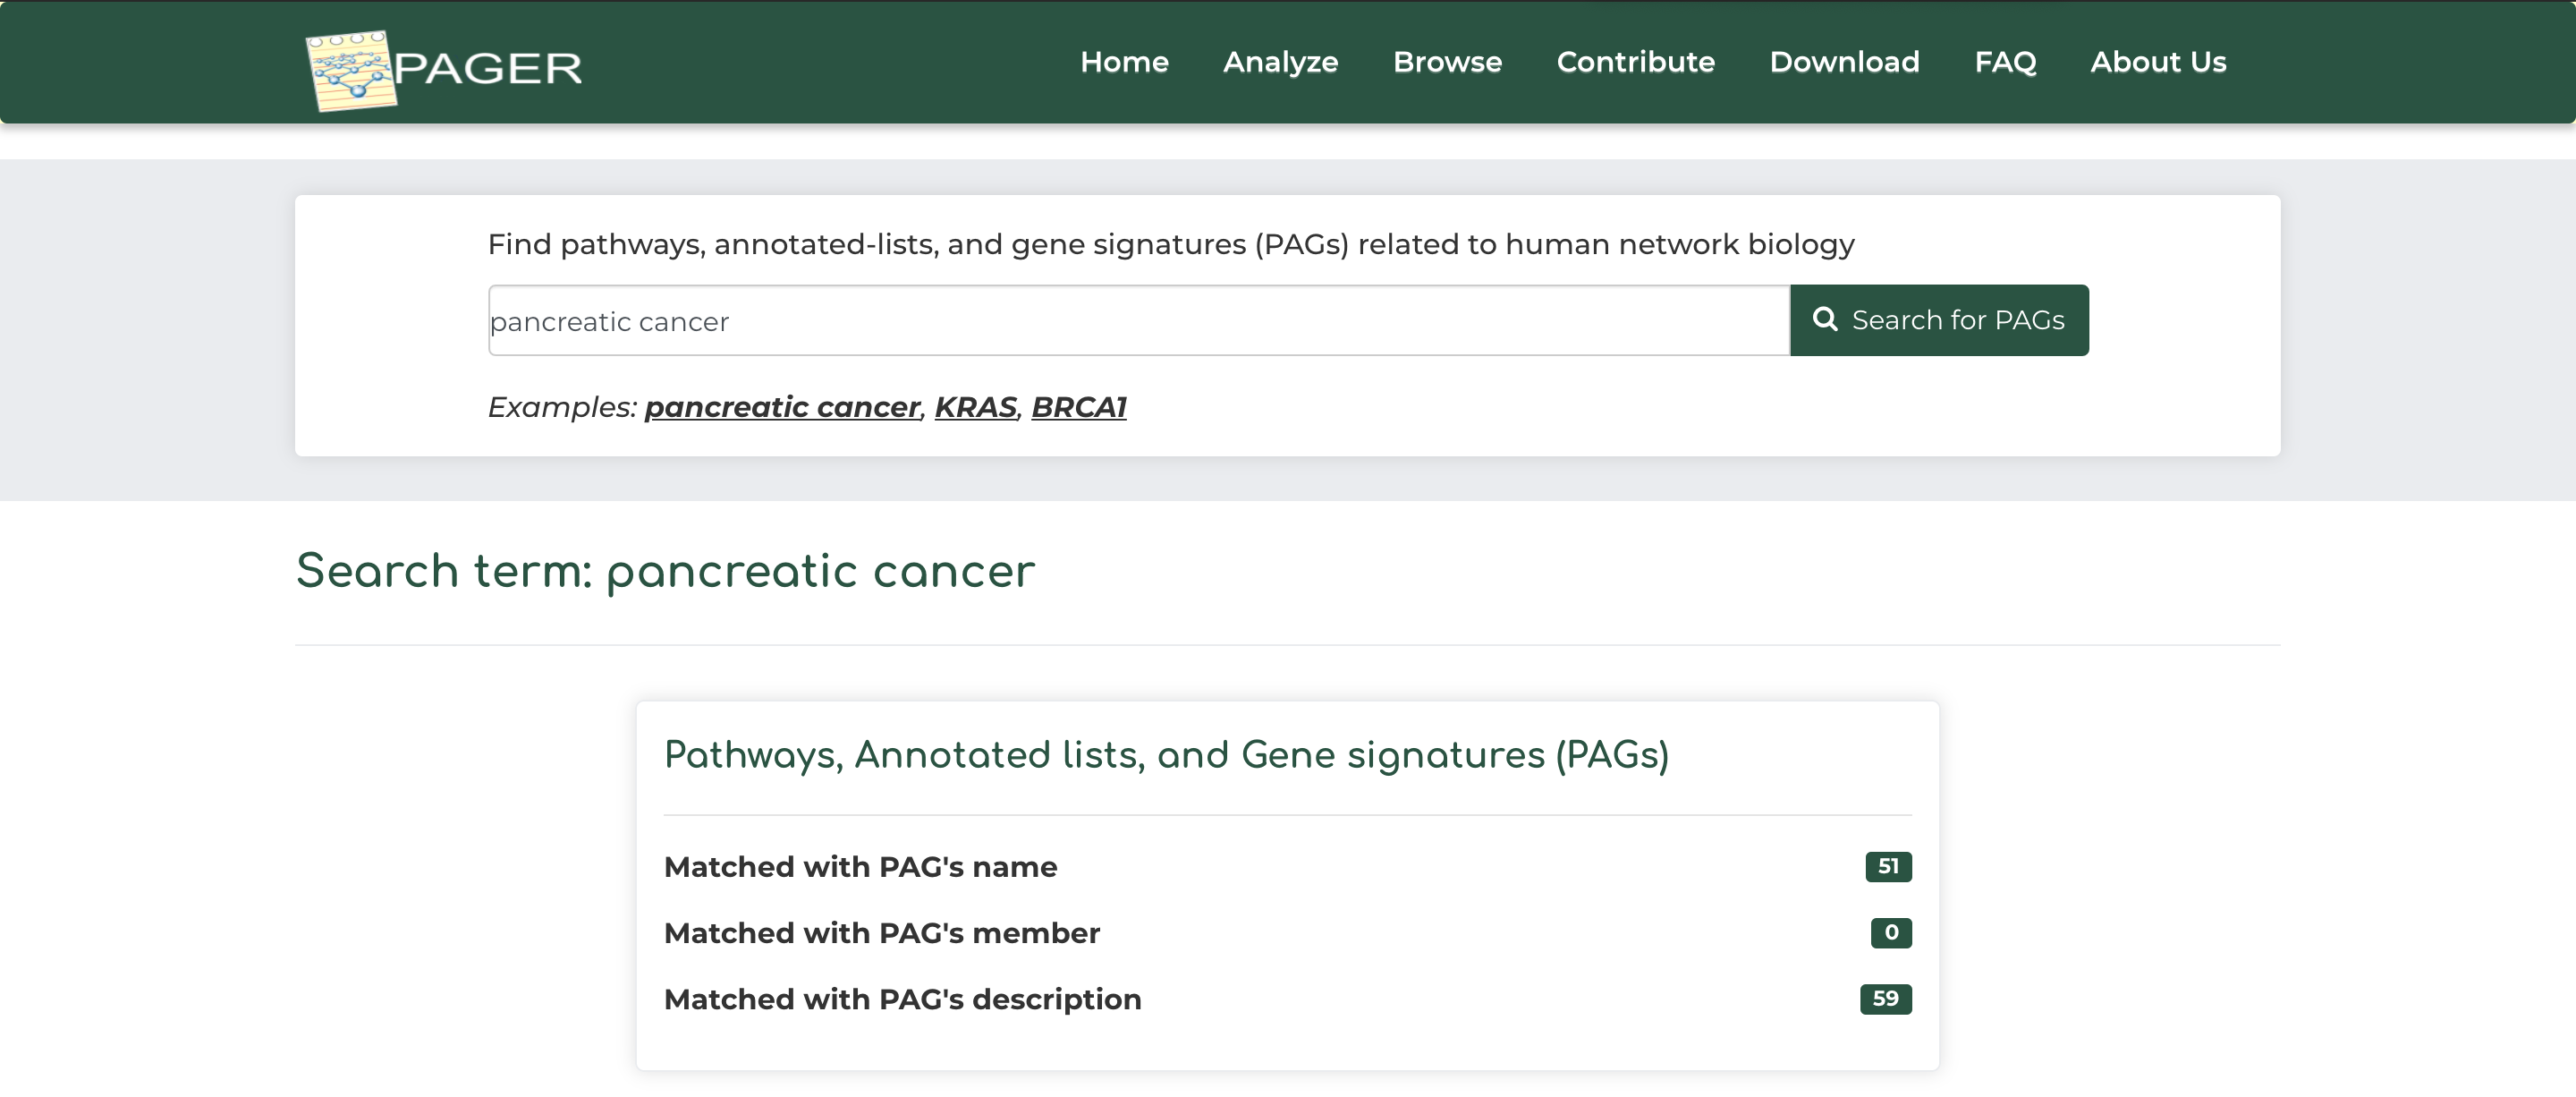
- As an example, click on ‘pancreatic cancer’ example under the basic search bar and click ‘Search for PAGs’.
- After searching, we see that PAGER brings a total of 3 results, with the ‘pancreatic cancer’ search query matching with 51 PAG name, and 59 PAG descriptions.
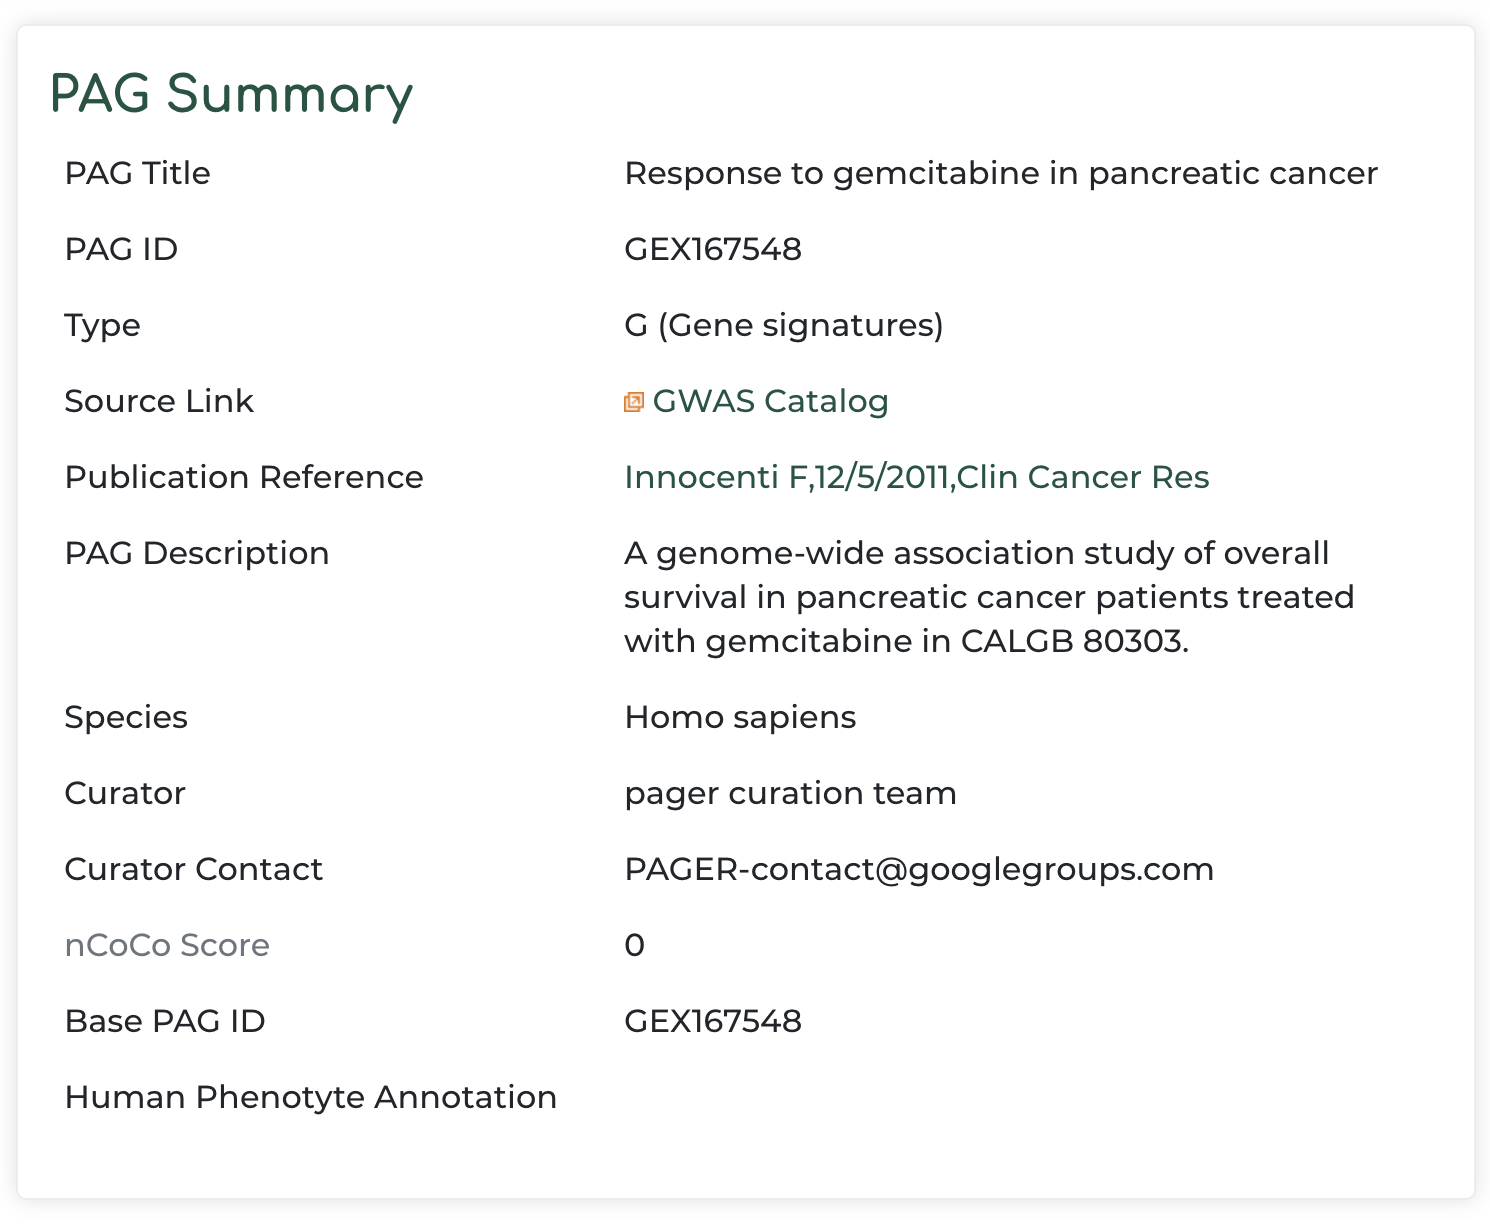
- Clicking on the green box to the right of PAGER results (in our example we click the green box representing the PAG name matched with ‘pancreatic cancer’ query), we get:
- PAG summary information with reference to the original data source:
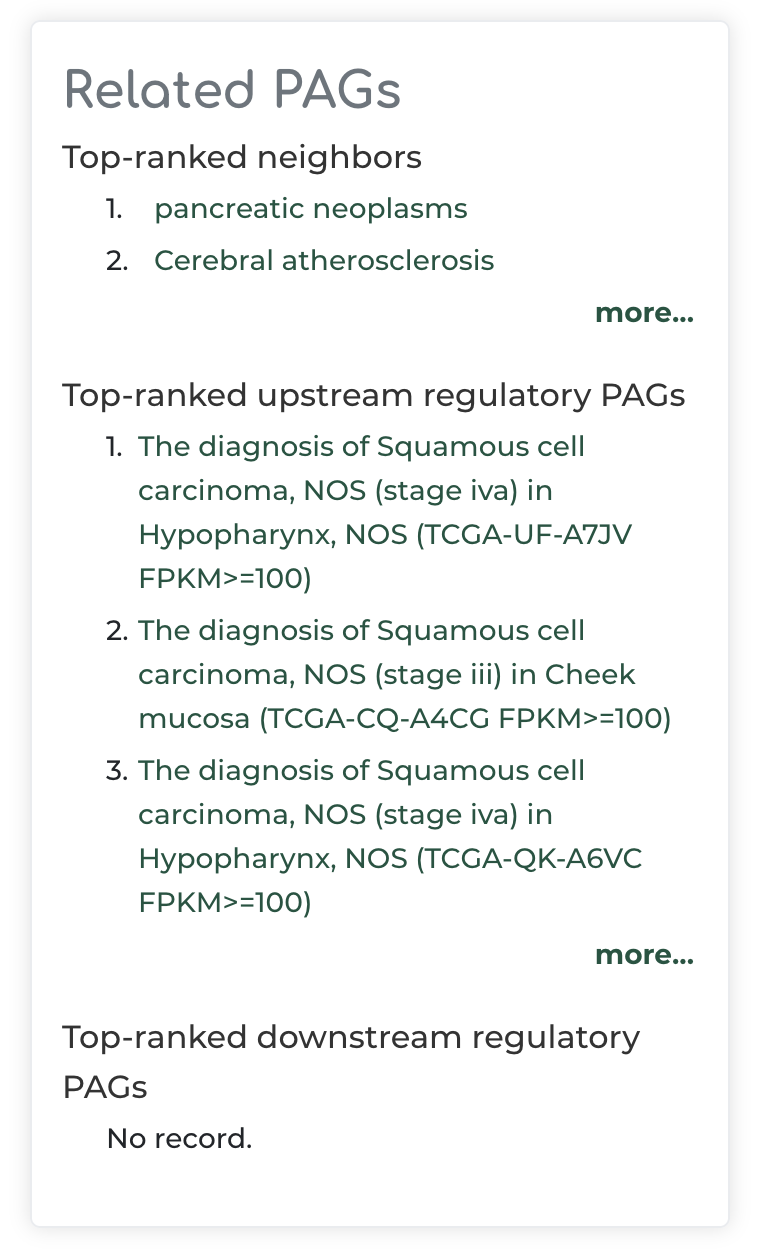
- Top-ranked related PAG neighbors, as well as top-ranked regulatory PAGs that are upstream or downstream to PAG of interest. These related PAGs can be clicked on if users are interested to explore further:
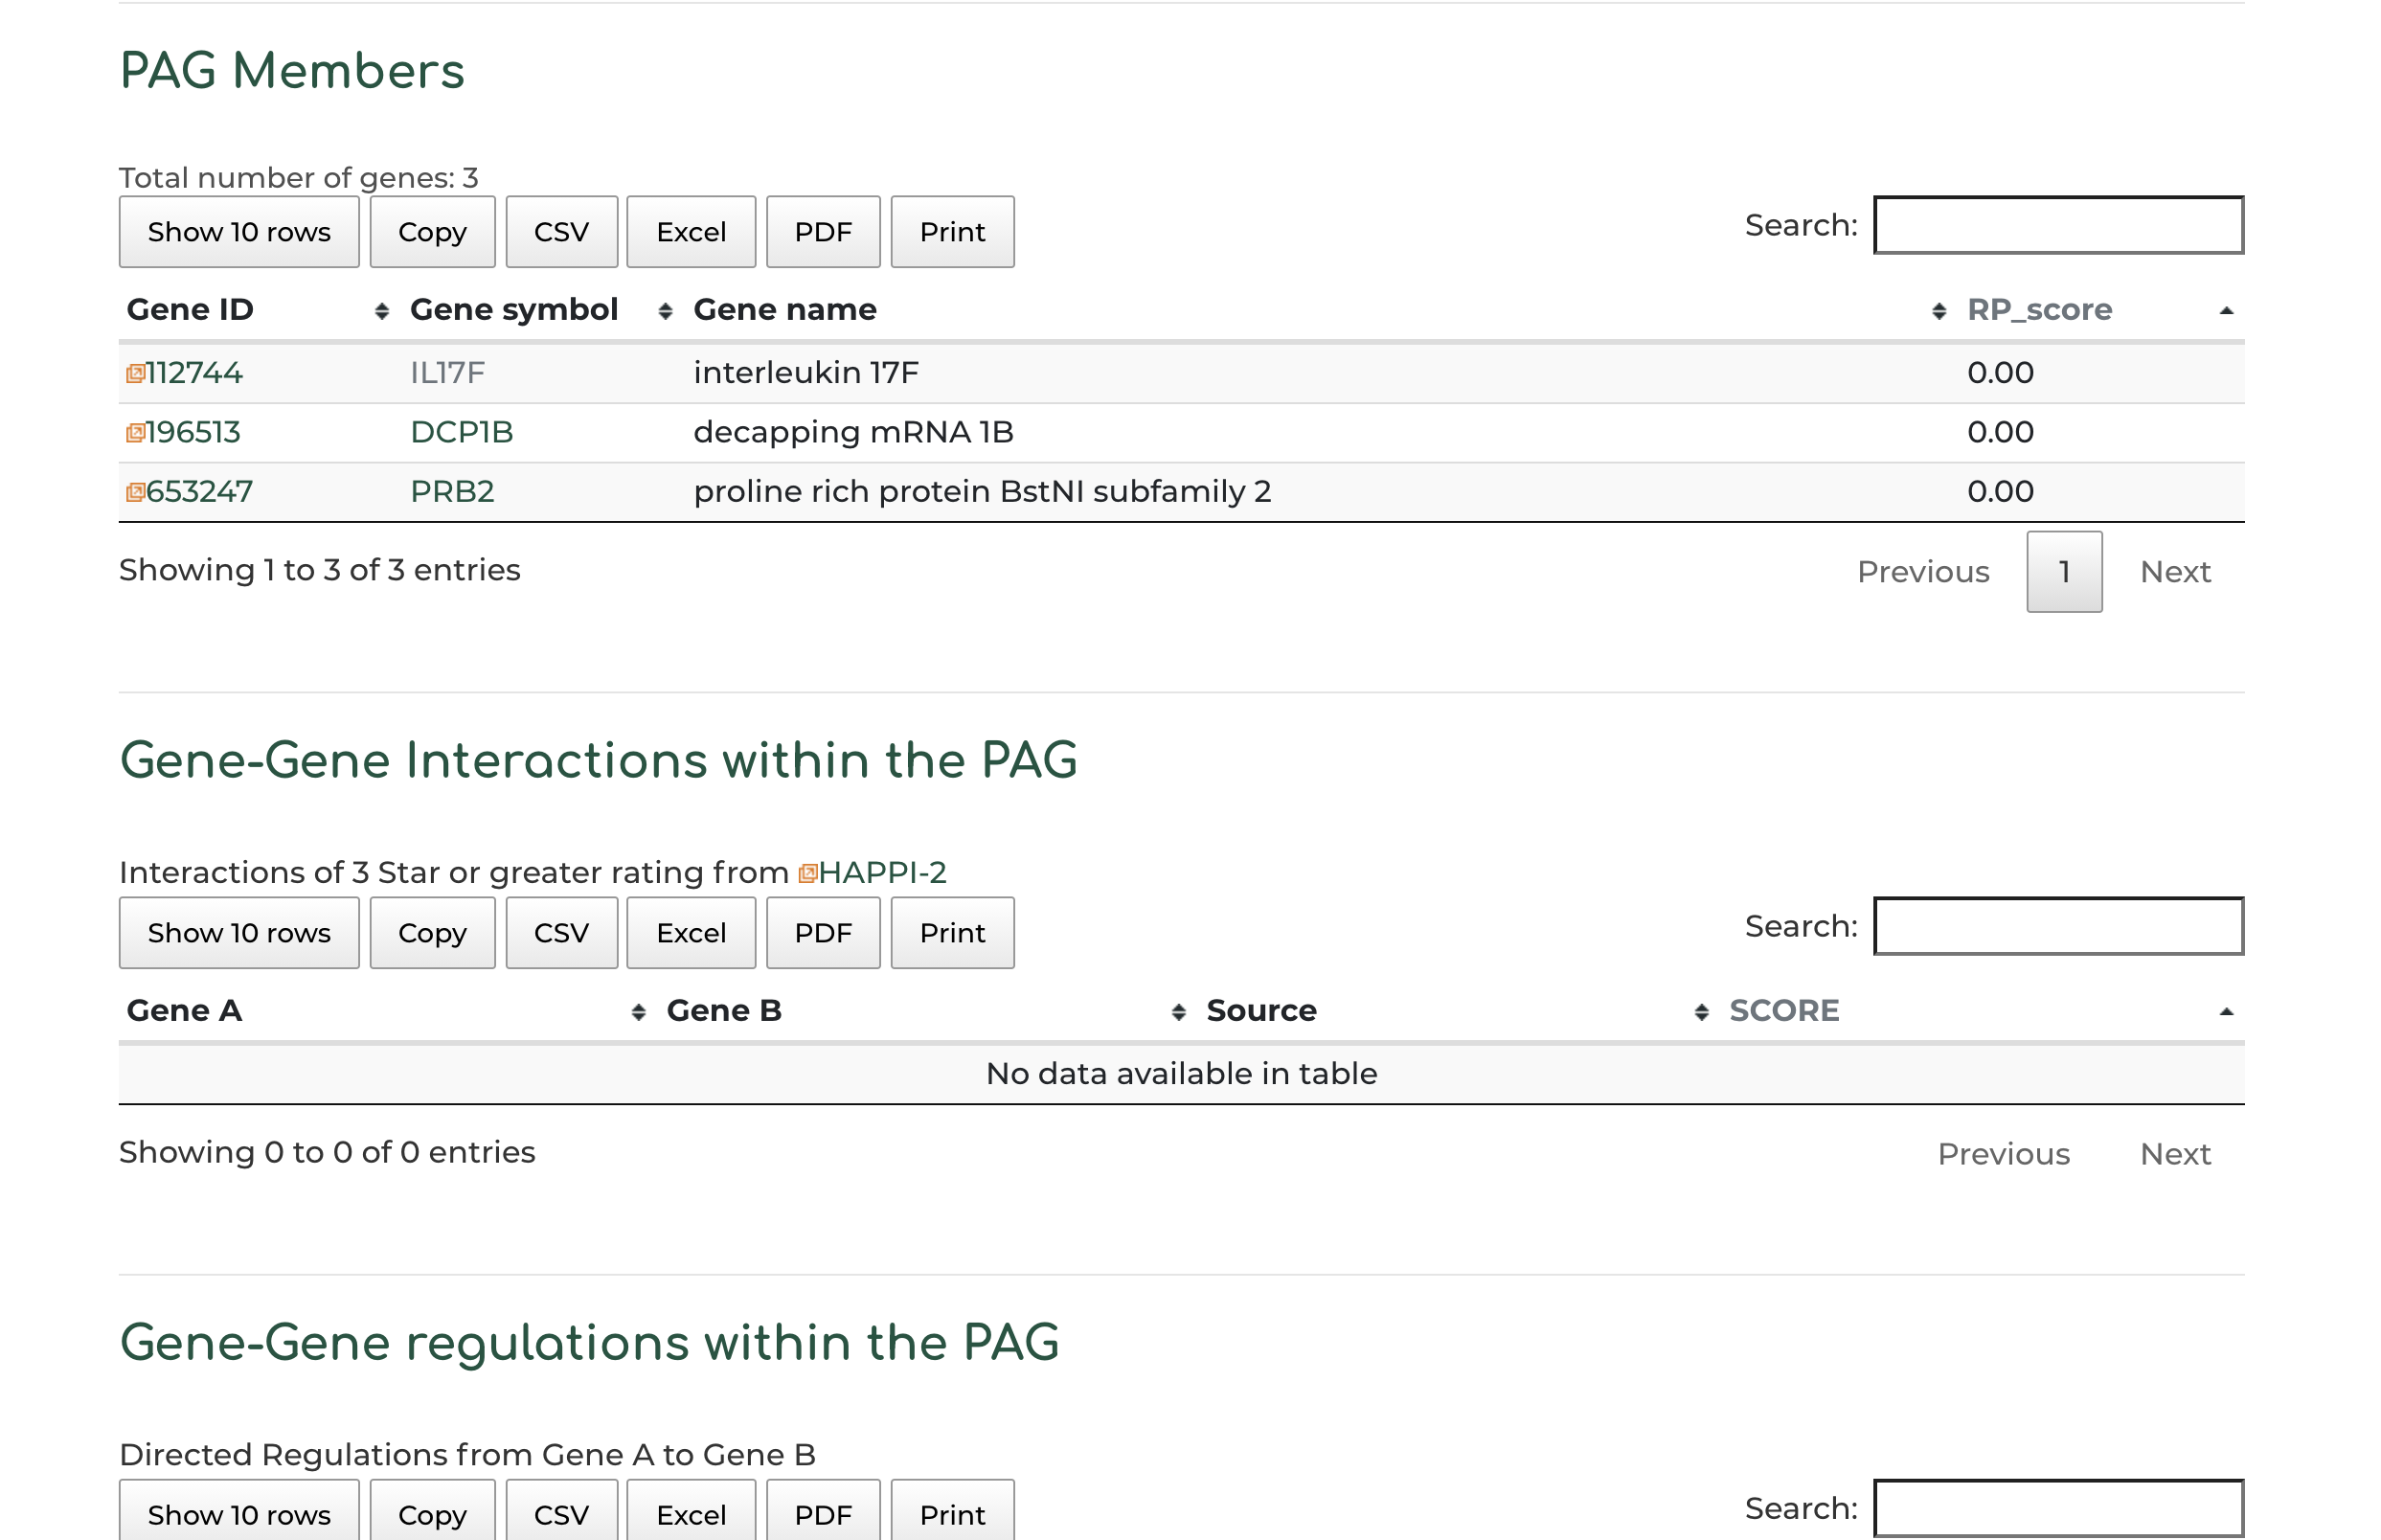
- Gene members within the PAG, alongside PAG gene member interaction and regulatory information:
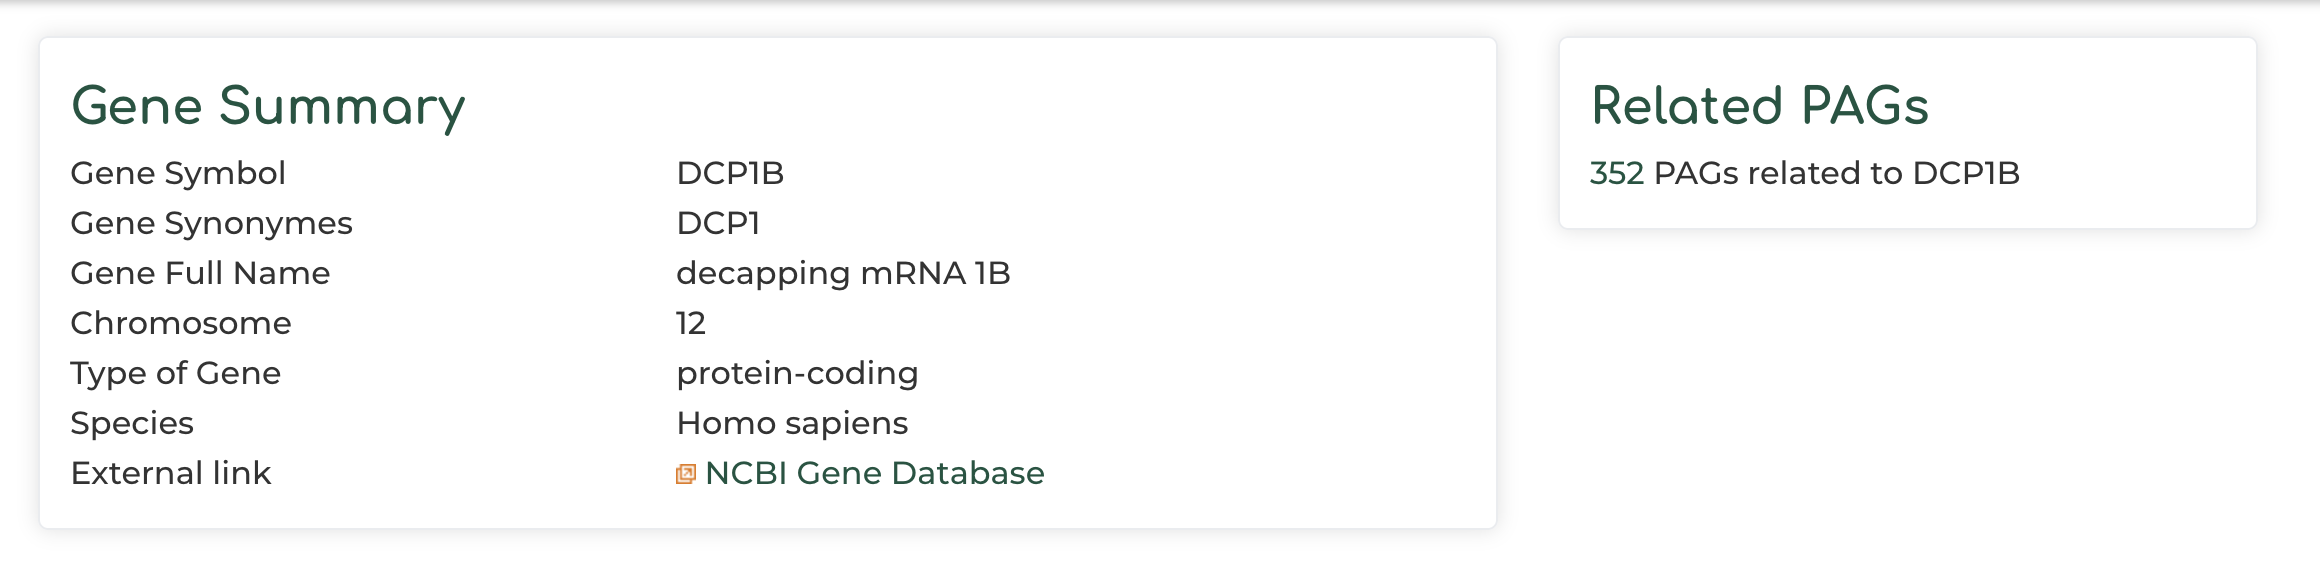
- Users can click on ‘Gene symbol’ within ‘PAG Members’ section to access information to PAG gene information. In our example we show the DCP1B gene:
Users can enter a list of genes obtained from their experiment or other data source to order to search for related PAGs in PAGER:
- On the PAGER home page, click on 'Advanced Search' option.
- Click on the example gene set provided in PAGER
- Click 'Search PAGs'.
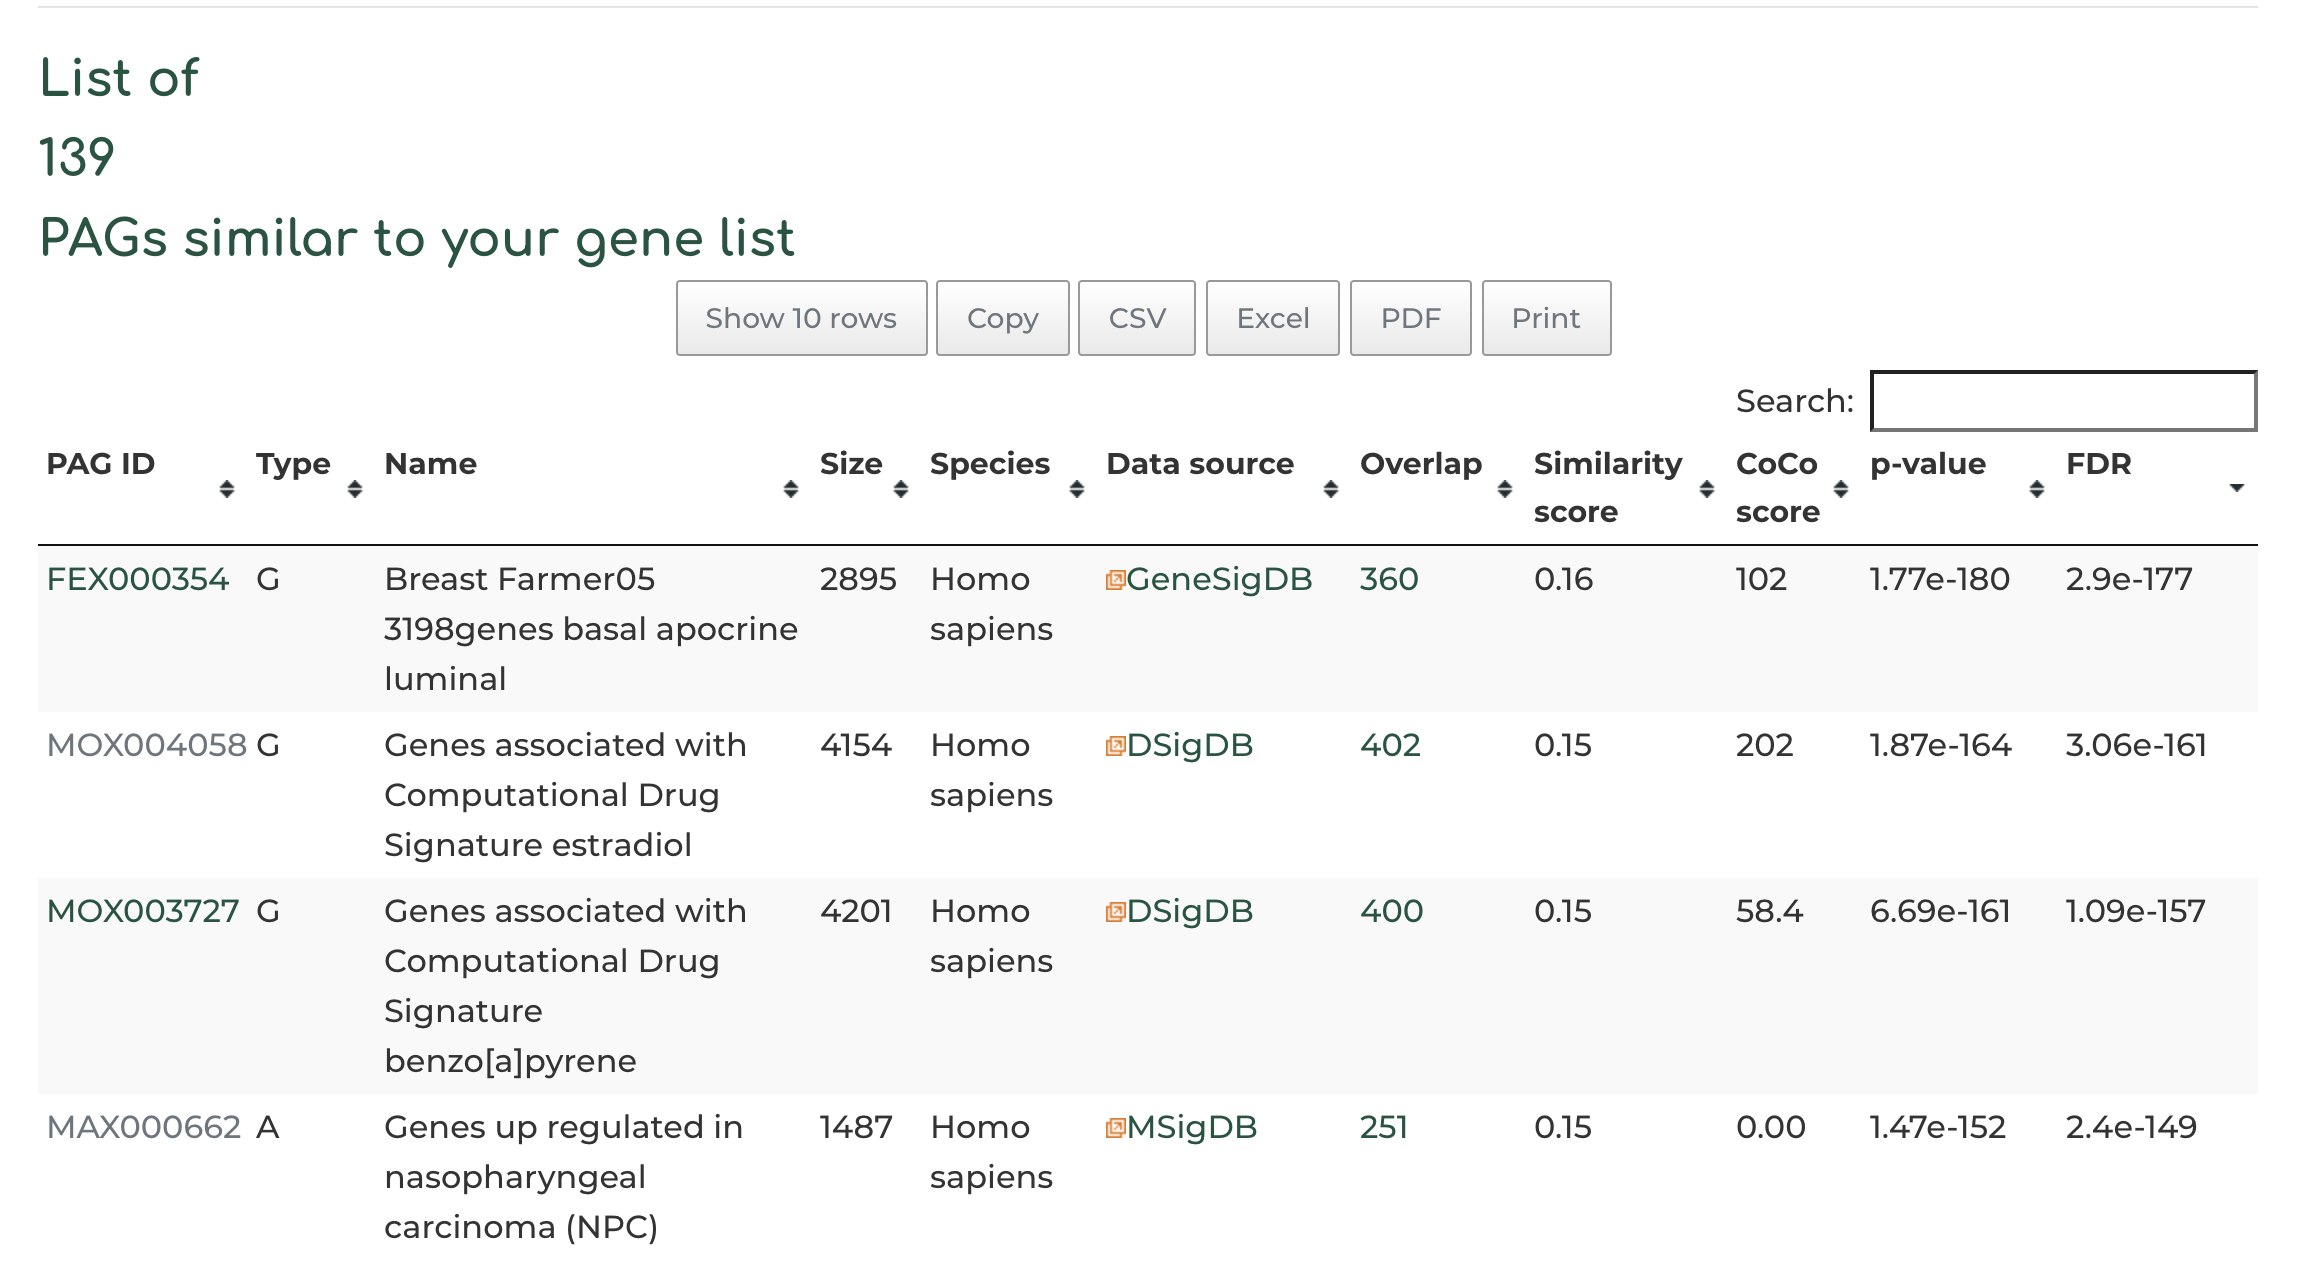
- After searching, we see 139 PAGs similar to our queried geneset, based on the standard filters. Users can view PAG results by clicking on the header row of table, based on overlap of number of genes (default setting), similarity score between query gene set and hits, CoCo score, p-value, etc:

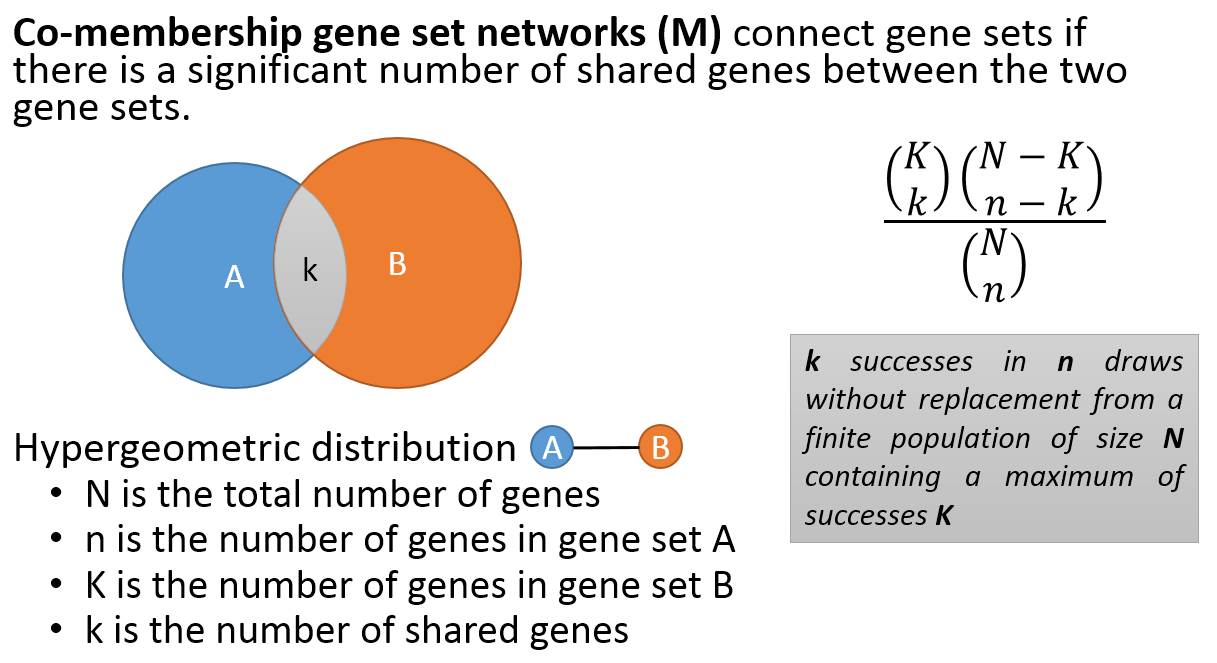
- Co-membership PAG-to-PAG networks (m-type PAG-to-PAG networks) connect a pair of PAGs if there is a significant number of shared genes.
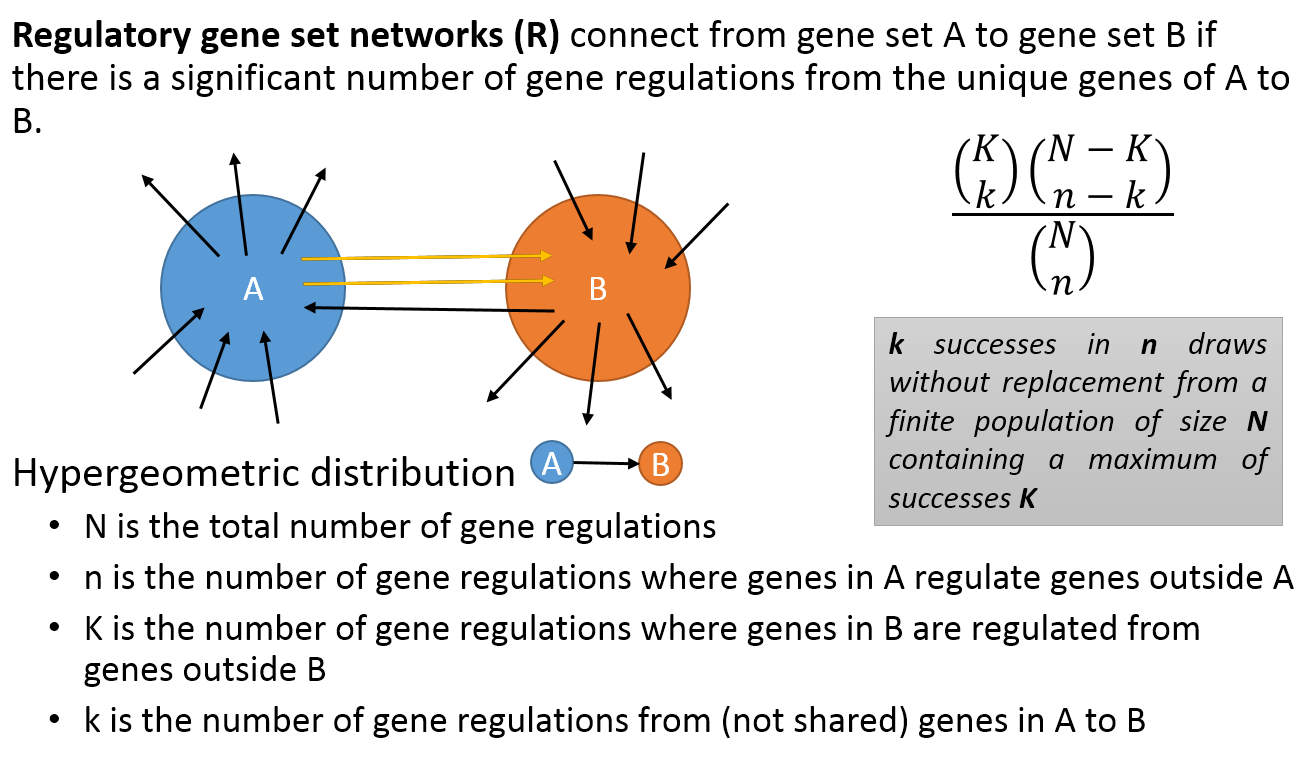
- A regulatory PAG-to-PAG network (r-type PAG-to-PAG network) connects a pair of PAGs when there is a significant number of gene regulations between the genes of the two PAGs.
-
Network Visualization frame consists of three major sections, Meta-Description, Network and Network Arguments.
Meta-Description section provides information on any selected node or interaction. These nodes can be a type of PAG in PAG-PAG networks or a gene in Gene-Gene networks. PAG nodes displays meta information including PAG name, PAG ID, PAG Size, PAG Type, nCOCO score, source and PAG description. Gene nodes contain the meta information, e.g. Gene Symbol, Name, EntrezID and RP Score.
The meta-description of interaction depends on the type of network. For a M-Type network, the interaction between two PAGs would typically consist of name and size of both PAGs, overlap value and a similarity index. For a R-Type Network, the interaction between two PAGs would typically consist of PAG_A_out, PAG_B_In, Total Size, and LogCDF.
Similarly in a Gene-to-Gene Interaction network the edges are weighted on the Protein-Protein Interaction Score calculated from HAPPI-2. The gene interaction network on PAGER typically contains PPI scores of 0.9 and above labelled as 5-star quality.
Edges in the Gene-to-Gene Regulation network represents the mechanism of regulation from Gene A to Gene B. The mechanism can be Activation, Inhibition, Phosphorylation or Transcriptomics Regulation. Different marker end and edge colors are implemented to represent these mechanisms and a legend is displayed for same in the network frame.
The RP-score (standing for rank prioritization-score) is used to rank genes within the PAG, allowing for output of a PAGER-ranked gene list.
We use RP-score to calculate and assign the gene weight in every PAG:

where p and q are the indexes of proteins from the selected module, k is a constant (k=2 in this study). The term conf(p, q) is the interaction confidence score assigned by HAPPI-2, where conf(p, q) is between 0 and 1. N(p, q) holds the value of 1 if protein p interacts with q or the value of 0 if protein p does not interact with q. We then rank the genes by the RP-score to pull out potential important genes in the top rank list.
A quality metric is a way to put a numerical value to a gene based on its statistically significant coverage of gene–gene functional correlations in gene pairs or gene trios. This data can be normalized and become the normalized cohesion coefficient, nCoCo, score. It can also be left as is and just be the cohesion coefficient, CoCo, score.
The nCoCo score takes into account PAG size bias when determining quality score of PAG results. Users can view PAGs similar to their queried gene list by nCoCo score by clicking on header arrows:
The nCoCo score represents a PAG quality metric and is improved from the initial CoCo score (a Cohesion Coefficient derived from the measure of statistically significant coverage of gene-gene functional correlations in gene pairs or gene trios) in our PAGER publication .
Information Content explains if a gene is rich, neutral, or poor in content. This is calculated by taking the logbase2 of the nCoCo, normalized cohesion coefficient, score. This new number is then compared to a set of ranges. If the number is less than 2.10, it is considered poor. If the number falls between the range of 2.10 and 2.72 it is classified as neutral. Lastly, if the number is greater than 2.72 it is considered rich in content. When a gene has a high nCoCo score and subsequently has an information content rating of rich, it means there are lots of connections or correlations between that gene and other genes. The nCoCo score also takes the PAG’s size into account, so it gives a comprehensive analysis.
Yes! Users may refer to this link for detailed instructions.
Yes! Users may refer to this link for contribution.
We try to make the content submission procedures easy for the user. We recommend users to upload geneset data using one of the two forms we provide.
1. Differential gene expression format (DEG) : Differentially expressed genes from your bulk RNA-sequencing or single-cell sequencing experiments.
2. Literature-curation format (LIT) : Genesets curated from related literature/reviews in your research field.
Once you submit your file, you will receive an email with a receipt ID for your submission. You can use this receipt ID to email us about any questions or updates about your submission.
The PAGER API allows developers to analyze gene lists, get enrichment results, and download files of enrichment results. We provide a demo using two R scripts and python scripts in performing the PAGER analysis using API.
-
The core function R script for accessing the PAGER API:
- PAGER.r The R script of calling the functions:
- PAGER_API_CALL.r
-
The core function python script for accessing the PAGER API:
- PAGER.py The python script of calling the functions:
- PAGER_API_CALL.ipynb
The database was developed based on the Gene ontology
The current PAGER database (version 3.0) is a substantial update of the published
References:
-
Chen, J. Y., C. Shen, Z. Yan, D. P. Brown and M. Wang (2006). "A systems biology case study of ovarian cancer drug resistance." Comput Syst Bioinformatics Conf: 389-398.
-
Chowbina, S. R., X. Wu, F. Zhang, P. M. Li, R. Pandey, H. N. Kasamsetty and J. Y. Chen (2009). HPD: an online integrated human pathway database enabling systems biology studies. BMC bioinformatics, BioMed Central.
-
Huang, H., X. Wu, M. Sonachalam, S. N. Mandape, R. Pandey, K. F. MacDorman, P. Wan and J. Y. Chen (2012). PAGED: a pathway and gene-set enrichment database to enable molecular phenotype discoveries. BMC bioinformatics, BioMed Central.
-
Yue, Z., M. M. Kshirsagar, T. Nguyen, C. Suphavilai, M. T. Neylon, L. Zhu, T. Ratliff and J. Y. Chen (2015). "PAGER: constructing PAGs and new PAG–PAG relationships for network biology." Bioinformatics 31(12): i250-i257.
-
Yue, Z., R. Slominski, S. Bharti and J. Y. Chen (2022). "PAGER Web APP: An Interactive, Online Gene Set and Network Interpretation Tool for Functional Genomics." Front Genet 13: 820361.
-
Yue, Z., E. Zhang, C. Xu, S. Khurana, N. Batra, S. D. H. Dang, J. J. Cimino and J. Y. Chen (2021). "PAGER-CoV: a comprehensive collection of pathways, annotated gene-lists and gene signatures for coronavirus disease studies." Nucleic acids research 49(D1): D589-D599.
-
Yue, Z., Q. Zheng, M. T. Neylon, M. Yoo, J. Shin, Z. Zhao, A. C. Tan and J. Y. Chen (2018). "PAGER 2.0: an update to the pathway, annotated-list and gene-signature electronic repository for Human Network Biology." Nucleic acids research 46(D1): D668-D676.
-
Yue, Z., Q. Zheng, M. T. Neylon, M. Yoo, J. Shin, Z. Zhao, A. C. Tan and J. Y. Chen (2018). "PAGER 2.0: an update to the pathway, annotated-list and gene-signature electronic repository for Human Network Biology." Nucleic acids research 46(D1): D668-D676.
-
Chen, J. Y., C. Shen, Z. Yan, D. P. Brown and M. Wang (2006). "A systems biology case study of ovarian cancer drug resistance." Comput Syst Bioinformatics Conf: 389-398.
-
Yue, Z., M. M. Kshirsagar, T. Nguyen, C. Suphavilai, M. T. Neylon, L. Zhu, T. Ratliff and J. Y. Chen (2015). "PAGER: constructing PAGs and new PAG–PAG relationships for network biology." Bioinformatics 31(12): i250-i257.
-
Yue, Z., R. Slominski, S. Bharti and J. Y. Chen (2022). "PAGER Web APP: An Interactive, Online Gene Set and Network Interpretation Tool for Functional Genomics." Front Genet 13: 820361.
-
Chen, J. Y., C. Shen, Z. Yan, D. P. Brown and M. Wang (2006). "A systems biology case study of ovarian cancer drug resistance." Comput Syst Bioinformatics Conf: 389-398.
-
Chowbina, S. R., X. Wu, F. Zhang, P. M. Li, R. Pandey, H. N. Kasamsetty and J. Y. Chen (2009). HPD: an online integrated human pathway database enabling systems biology studies. BMC bioinformatics, BioMed Central.
-
Huang, H., X. Wu, M. Sonachalam, S. N. Mandape, R. Pandey, K. F. MacDorman, P. Wan and J. Y. Chen (2012). PAGED: a pathway and gene-set enrichment database to enable molecular phenotype discoveries. BMC bioinformatics, BioMed Central.
-
Yue, Z., M. M. Kshirsagar, T. Nguyen, C. Suphavilai, M. T. Neylon, L. Zhu, T. Ratliff and J. Y. Chen (2015). "PAGER: constructing PAGs and new PAG–PAG relationships for network biology." Bioinformatics 31(12): i250-i257.
-
Yue, Z., Q. Zheng, M. T. Neylon, M. Yoo, J. Shin, Z. Zhao, A. C. Tan and J. Y. Chen (2018). "PAGER 2.0: an update to the pathway, annotated-list and gene-signature electronic repository for Human Network Biology." Nucleic acids research 46(D1): D668-D676.
-
Yue, Z., E. Zhang, C. Xu, S. Khurana, N. Batra, S. D. H. Dang, J. J. Cimino and J. Y. Chen (2021). "PAGER-CoV: a comprehensive collection of pathways, annotated gene-lists and gene signatures for coronavirus disease studies." Nucleic acids research 49(D1): D589-D599.
-
Yue, Z., R. Slominski, S. Bharti and J. Y. Chen (2022). "PAGER Web APP: An Interactive, Online Gene Set and Network Interpretation Tool for Functional Genomics." Front Genet 13: 820361.