A Comprehensive Database of
Human Annotated and Predicted Protein Interactions
A Comprehensive Database of
Human Annotated and Predicted Protein Interactions
The Human Annotated and Predicted Protein Interaction (HAPPI) Database is a free, open-access, and comprehensive database collection
of computer annotated human protein-protein interactions from public data sources and computational predictions.
The database was developed by exhaustively integrating publicly available human protein interaction data from BioGRID,I2D, IntnetDB, HPRD, and STRING
databases into a data warehouse powered by our Oracle 11g relational database server. In the data warehouse, various types of sequence, structure, pathway, and literature annotation data from
established bioinformatics resources such as NCBI, PubMed, UniProt, HUGO, EBI, PDB were also integrated. Our long-term goal is to develop a
new type of protein interaction database resource for biomedical scientists, who are interested in evaluating biological significant protein interactions,
developing disease pathway models, and identifying disease drug targets or diagnostic biomarkers.
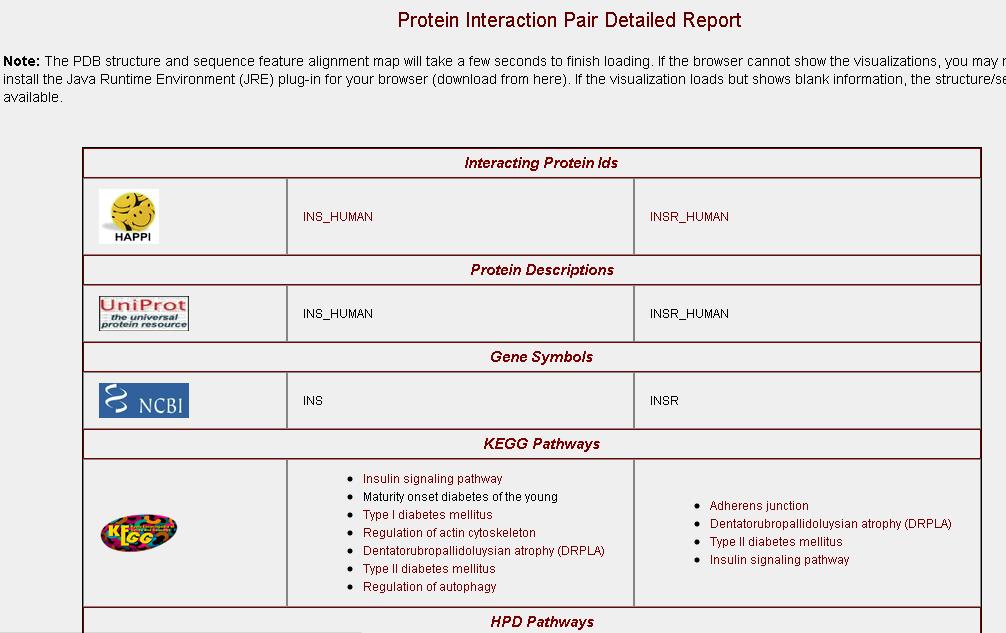
In the current release of the HAPPI database, users can examine protein interaction in many ways.
For both in-depth technical details and citation of this work, please refer to the following article:
Jake Y. Chen, SudhaRani Mamidipalli, and Tianxiao Huan (2009) HAPPI: an Online Database of Comprehensive Human Annotated and Predicted Protein Interactions, BMC Genomics, Vol. 10, Suppl 1: S16 (free access here)
HAPPI database is developed as a classical 3-tier data-driven web application.
The majority of the human protein interaction data are extracted and integrated from HPRD, BioGRID, IntNetDB, STRING, and the I2D databases. In particular, we adopted the data source naming standard from the I2D database (for a listing all possible data source values, read here). For data integrated from HPRD, BioGrid we directly use the database names as the data source names.. In summary, the data sources are:
| Database | Description |
|---|---|
| BioGRID | Database of Protein and Gene Interactions |
| HPRD | Human protein interactions found in the HPRD database |
| IntNetDB | Integrated protein interaction network database |
| (misc.) | Additional recent experimental high-throughput human protein interaction data found in published studies, including JonesErbB1, Pawson, StelzlLow, StelzlMedium, StelzlHigh, VidalHuman_core, and VidalHuman_non_core |
| STRING | Human protein interactions found in the STRING database |
| (other) | Human protein interactions computationally derived and described in the I2D database. The various codes indicate the types of source interaction data used to derive human interaction data. These include: CORE_1, CORE_2, NON_CORE, LITERATURE, SCAFFOLD, INTEROLOG, and CE_DATA from C elegans; low, medium, high, and Krogran_Core from yeast; AfCS, Suzuki, RikenDIP, RikenLit, and RikenBIND from mouse; FlyHigh, FlyLow, and FlyCellCycle from D. melanogaster; and WranaHigh, WranaMedium, and WranaLow from LUMIER. |
We developed a unified scoring model to assess the reliability of human protein-protein interactions integrated from public protein interaction databases. First, independent scoring systems for individual protein interaction databases to be integrated were developed (after consulting with our collaborating biomedical scientists), primarily based on heuristic scoring of experimental or computational protocol categories. Each interaction pair under a specific experimental/computational derivation method from a given source is assigned a heuristic confidence score Si, which provides an estimation how reliable or trustworthy interaction data from the method/source are. Therefore, the more trustworthy the experimental or computational protocols that generate the interaction data, the higher the confidence score Si.
| Score | Datasource |
|---|---|
| 0.80 | Curated Human Protein Interactions found in HPRD, BIND, and MINT |
| 0.75 | High-throughput human protein interaction experimental data |
| 0.70 | Human protein interactions in I2D predicted from mouse and rats |
| 0.65 | High-quality human protein interactions in I2D predicted from drosophila |
| 0.60 | Medium-quality human protein interactions in I2D predicted from various mouse, rat, and drosophila projects |
| 0.50 | Human protein interaction data inferred from medium-to-high quality worm and yeast data; high-quality text mining results from STRING |
| 0.40 | Human protein interaction data inferred from low-quality worm or curated/high-quality yeast data (including those from MIPS yeast); medium-quality text mining results imported primarily from the STRING database |
| 0.05-0.35 | Human protein interaction data inferred from non-interaction data sources (indirect association evidence); low-to-medium-quality text mining results imported primarily from STRING database |
Then, we used a score combination formula (listed below) to combine the individual confidence scores into a final h-score for each interaction that are derived from multiple experimental and computational methods or from different data sources:

In the above formula, N represents the total count of different data sources and conditions where an indepent assessment of protein interaction reliability score Si exist.
We used a ranking method that works in principle by clustering the distribution of h-scores for all interactions managed in the HAPPI database. The distribution of h-score ranges from 0 to 1. Based on combined score distributions binned properly (see figure below), a 5-star ranking model was developed, where the cutoff threshold is defined at the boundary of significant fall-off or rising bins measured by the "sum of counted interaction" value at the y-axis.
Therefore, based on the above binned h-score distribution, our ranking star ratings for each interaction in the HAPPI database is defined with the following threshold values of h-scores:
| h-score < 0.25 | noisy and unsupported interactions | |
| 0.25 <= h-score < 0.45 | very-low-confidence interactions | |
| 0.45 <= h-score < 0.75 | low-confidence interactions | |
| 0.75 <= h-score < 0.90 | medium-confidence interactions | |
| 0.90 <= h-score <=1 | high-confidence interactions |
Note that while reporting HAPPI database stastics, we only use interactions with h-score >= 0.75 (ranked at 4 or 5 star ratings). We do not include plausible interactions in the h-score <0.75 (ranked 1, 2, or 3 stars) in the statistics, although we do allow querying and retrieval of interactions at the rank of 3 star and above. Note that most of the interactions labelled as 3 stars and below are derived from STRING database or text mining methods, where often co-currence of gene/protein names were mentioned above certain frequencies in the same text. It remains uncertain how much interactions from this subset of data are real. Therefore they are excluded from the statistics report of HAPPI database.
High-quality conserved gene co-expression profiles are used to assess protein interaction quality for the HAPPI database. Many protein interaction data set have been cross-validated with human gene co-expression profiles. While interacting proteins may share highly similar gene expression profiles, it was sometimes suggested that such expected correlation between protein interactions and gene expression is weaker in human than in model organisms. Tirosh and Barkai found out that, to improve the development of a confidence measure for interacting proteins, the application of co-expression of orthologs of interacting partners is a more reliable method for verifying protein interactions where comprehensive expression profiles are difficult to compile among all conditions and the interactions may be transient [41]. This is based on the assumption that evolutionary co-expression relationship is a reliable predictor for how true protein interaction may have evolved and conversed functionally. Therefore, it is more sensitive overall than using information purely from the organism, e.g., simple co-expression, cellular co-localization, and similarity in gene’s gene ontology functional annotations. In a similar study, Bhardwaj and Lu also verified that reliable predictions of interactions from heterogeneous data sources can be strengthened by evolutionary preserved gene co-expression measurements [42]. Therefore, we choose to apply conserved evolutionary co-expression pairs to the assessment and comparisons of PPI data qualities for different sources.
We evaluated the quality of a sufficiently large PPI data set based on the degree of overlaps between protein interactions and evolutionary conserved co-expressed genes found in the MetaGene data set, which consists of 22,163 evolutionary conserved co-expression gene pairs based on the analysis of over 3182 published DNA microarray experiments by Stuart et al [43]. MetaGene is a comprehensive
compilation of evolutionary conserved gene co-expression pairs from a diverse set of DNA microarray experiments that were obtained from four different organisms: 1,202 DNA microarrays from humans, 979 from worms, 155 from flies, and 643 from yeast. The relative quality of each PPI database, including HAPPI, I2D, IntNetDB, ProNet, UniHI, and HPRD, was estimated as the percentage of overlap between
protein interactions in the PPI database of interest and MetaGene pairs. The upper-bound of such overlap, is given by counting unified set of PPIs from all these six human PPI databases that can be mapped with MetaGene pairs—6,297 in all, or 6,145 PPIs from the largest connected components of the network. The lower-bounder of such overlap, is given by creating a random reference set of 37,000 PPIs
pairs comparable to the size of PPIs in the HPRD database and comparing the mean degree of overlap between a random sub-sample (size=1,000) of PPIs with MetaGene pairs repetitively 1,000 times.
Therefore, to assess the quality of HAPPI datasets at different quality ranking levels, e.g., between 1-star and 5-star, we calculated the overlap between PPIs at a given quality ranking level from HAPPI and MetaGene pairs.
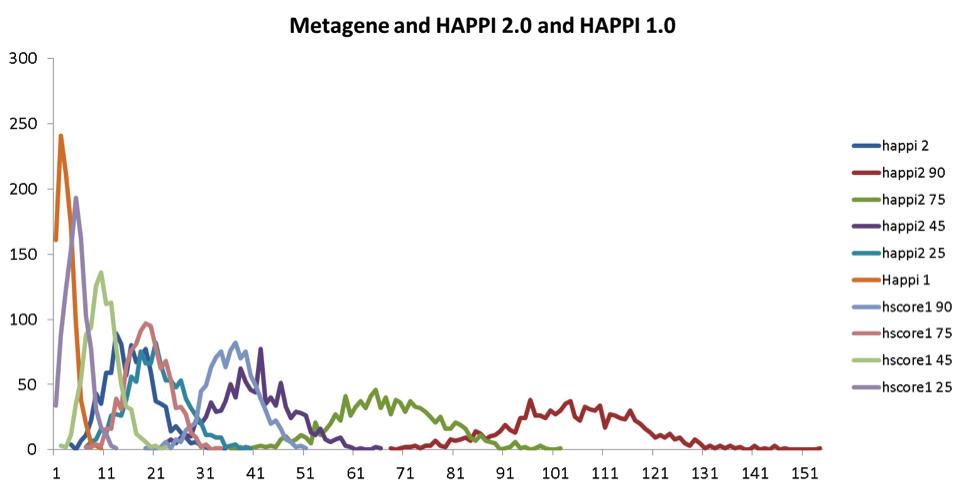
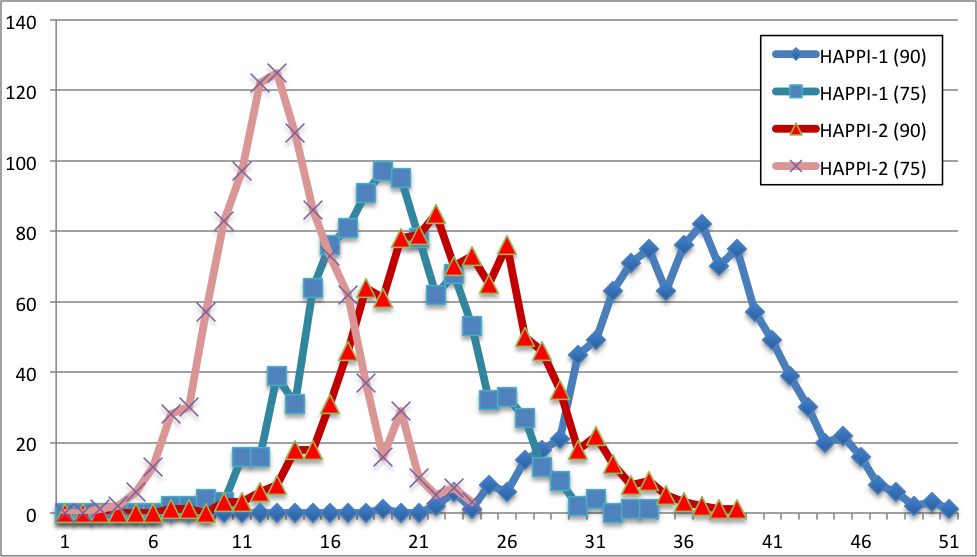
Degree of overlaps between randomly selected protein interaction pairs in selected protein interaction databases and MetaGene pairs. We randomly selected 1,000 protein-protein interactions, and count the numbers of protein interaction pairs overlapped with conserved co-expression pairs in the MetaGene database. This randomization and MetaGene overlap counting was repeated for 1000 time for each protein interaction database, and the resulting distribution is show as profiles on the graph. The scale of x-axis is normalized to make overlapping of all possible 6145 MetaGenes to be 100%. Panel A and B shows a comparison of distributions of MetaGene overlap counts for randomized samples of HAPPI-1 and HAPPI-2 database subsets.
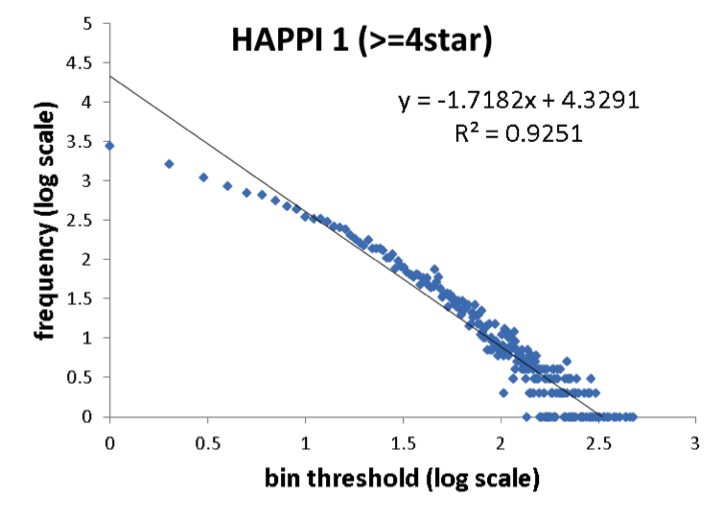
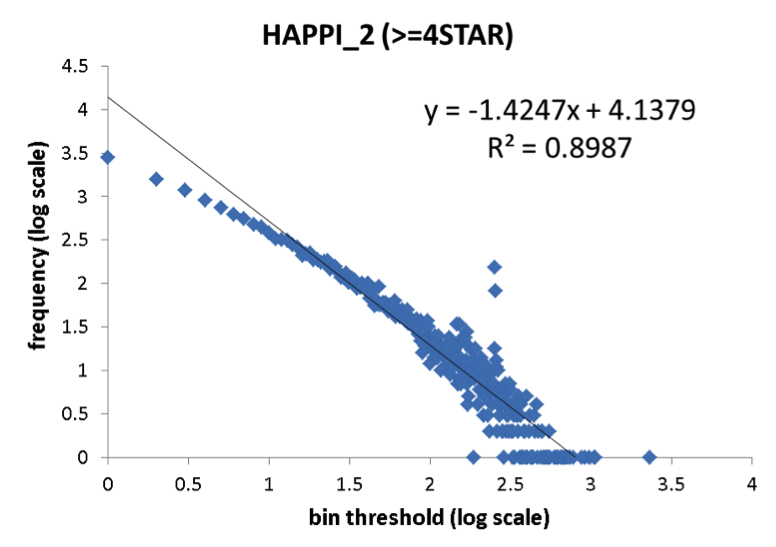
A comparison of protein network degree distribution between HAPPI-1 and HAPPI-2.The two sets of data showed similar intercept and R2 for the linear function in the node degree distributions plotted using log-log scales, with HAPPI-2 having slightly flatter slopes thus showing the trend for the updated HAPPI-2 to have 'network hubs' with higher degree of connectivity than HAPPI-1 data as the data coverage expands. .
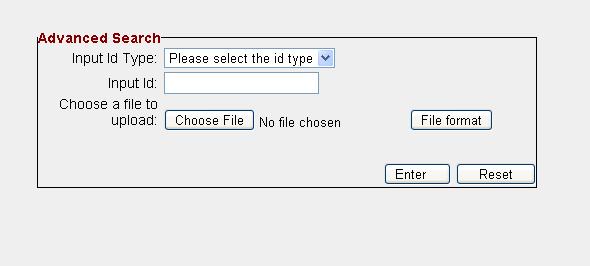
Our's is a web-based query interface for searching the interactions in HAPPI database. Users can then download the interactions or save them by for further analysis.

In order to search interactions using other ids use the Advanced Search link.
 to the left of each interacting protein to navigate to the "Protein Interaction Detail" page (see list #4 below). The relationship symbols, although currently only implemented as <=> bi-directional, have been reserved to be uni-direcional ('=>', query protein recruits partner proteins in interaction; or, "<=", partner protein
recruits query protein in interaction).
to the left of each interacting protein to navigate to the "Protein Interaction Detail" page (see list #4 below). The relationship symbols, although currently only implemented as <=> bi-directional, have been reserved to be uni-direcional ('=>', query protein recruits partner proteins in interaction; or, "<=", partner protein
recruits query protein in interaction).